Instagram is one of the most used social media networks in the world. It’s the perfect place to publicize your content and, if utilized in an intelligent way, generate unique interaction with your followers. That is why today we bring you a practical and basic guide to understanding Instagram statistics.
The application offers its users and content creators statistics of the account in general, of publications, stories and IGTV videos. These tools allow you to obtain valuable information such as the engagement rate, which is essential to measure the effectiveness of the created content.
Remember that if you want to have access to Instagram statistics, you must change your personal account to a business account.
How to understand general statistics on your account
These statistics allow us to analyze things such as our content, activity, visits to our profiles and user interactions with our account. You can analyze two very important things through them: reach and impressions..
Reach is related to the approximate number of unique visitors who have seen your posts, while impressions are the number of times the post made an impression on new or duplicate users, that is, the total number of times your posts were viewed.
One important thing about this tool is that you can analyze how your audience has been growing or decreasing in the last 7 days, the main places where your audience is located, their gender and the range of days and hours that your content functions best and also the number of followers you have gained or lost.
How to analyze statistics of your stories
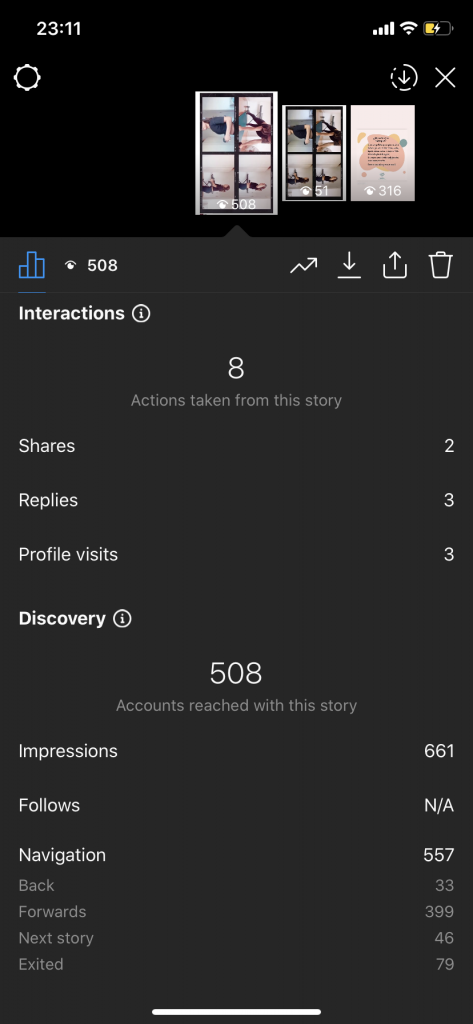
When you swipe up a story on Instagram, you can analyze its results as a publication up to 14 days after uploading it.

As you can see, you can analyze things like how many times your story has been shared, how many people have responded to it, and how many people have decided to visit your profile from your story.
In addition, you will be able to see elements such as total impressions, new followers, how many people stayed watching your content, the number of times the story has been clicked on to go back or forward, and how many people have left your story without viewing all the content.
How to understand statistics of your publications
This statistic allows you to know how your publications behave via interactions with your content through likes, comments, sharing and saving. Through your publications you will be able to know which are the best days and the best hours to post content on Instagram.


