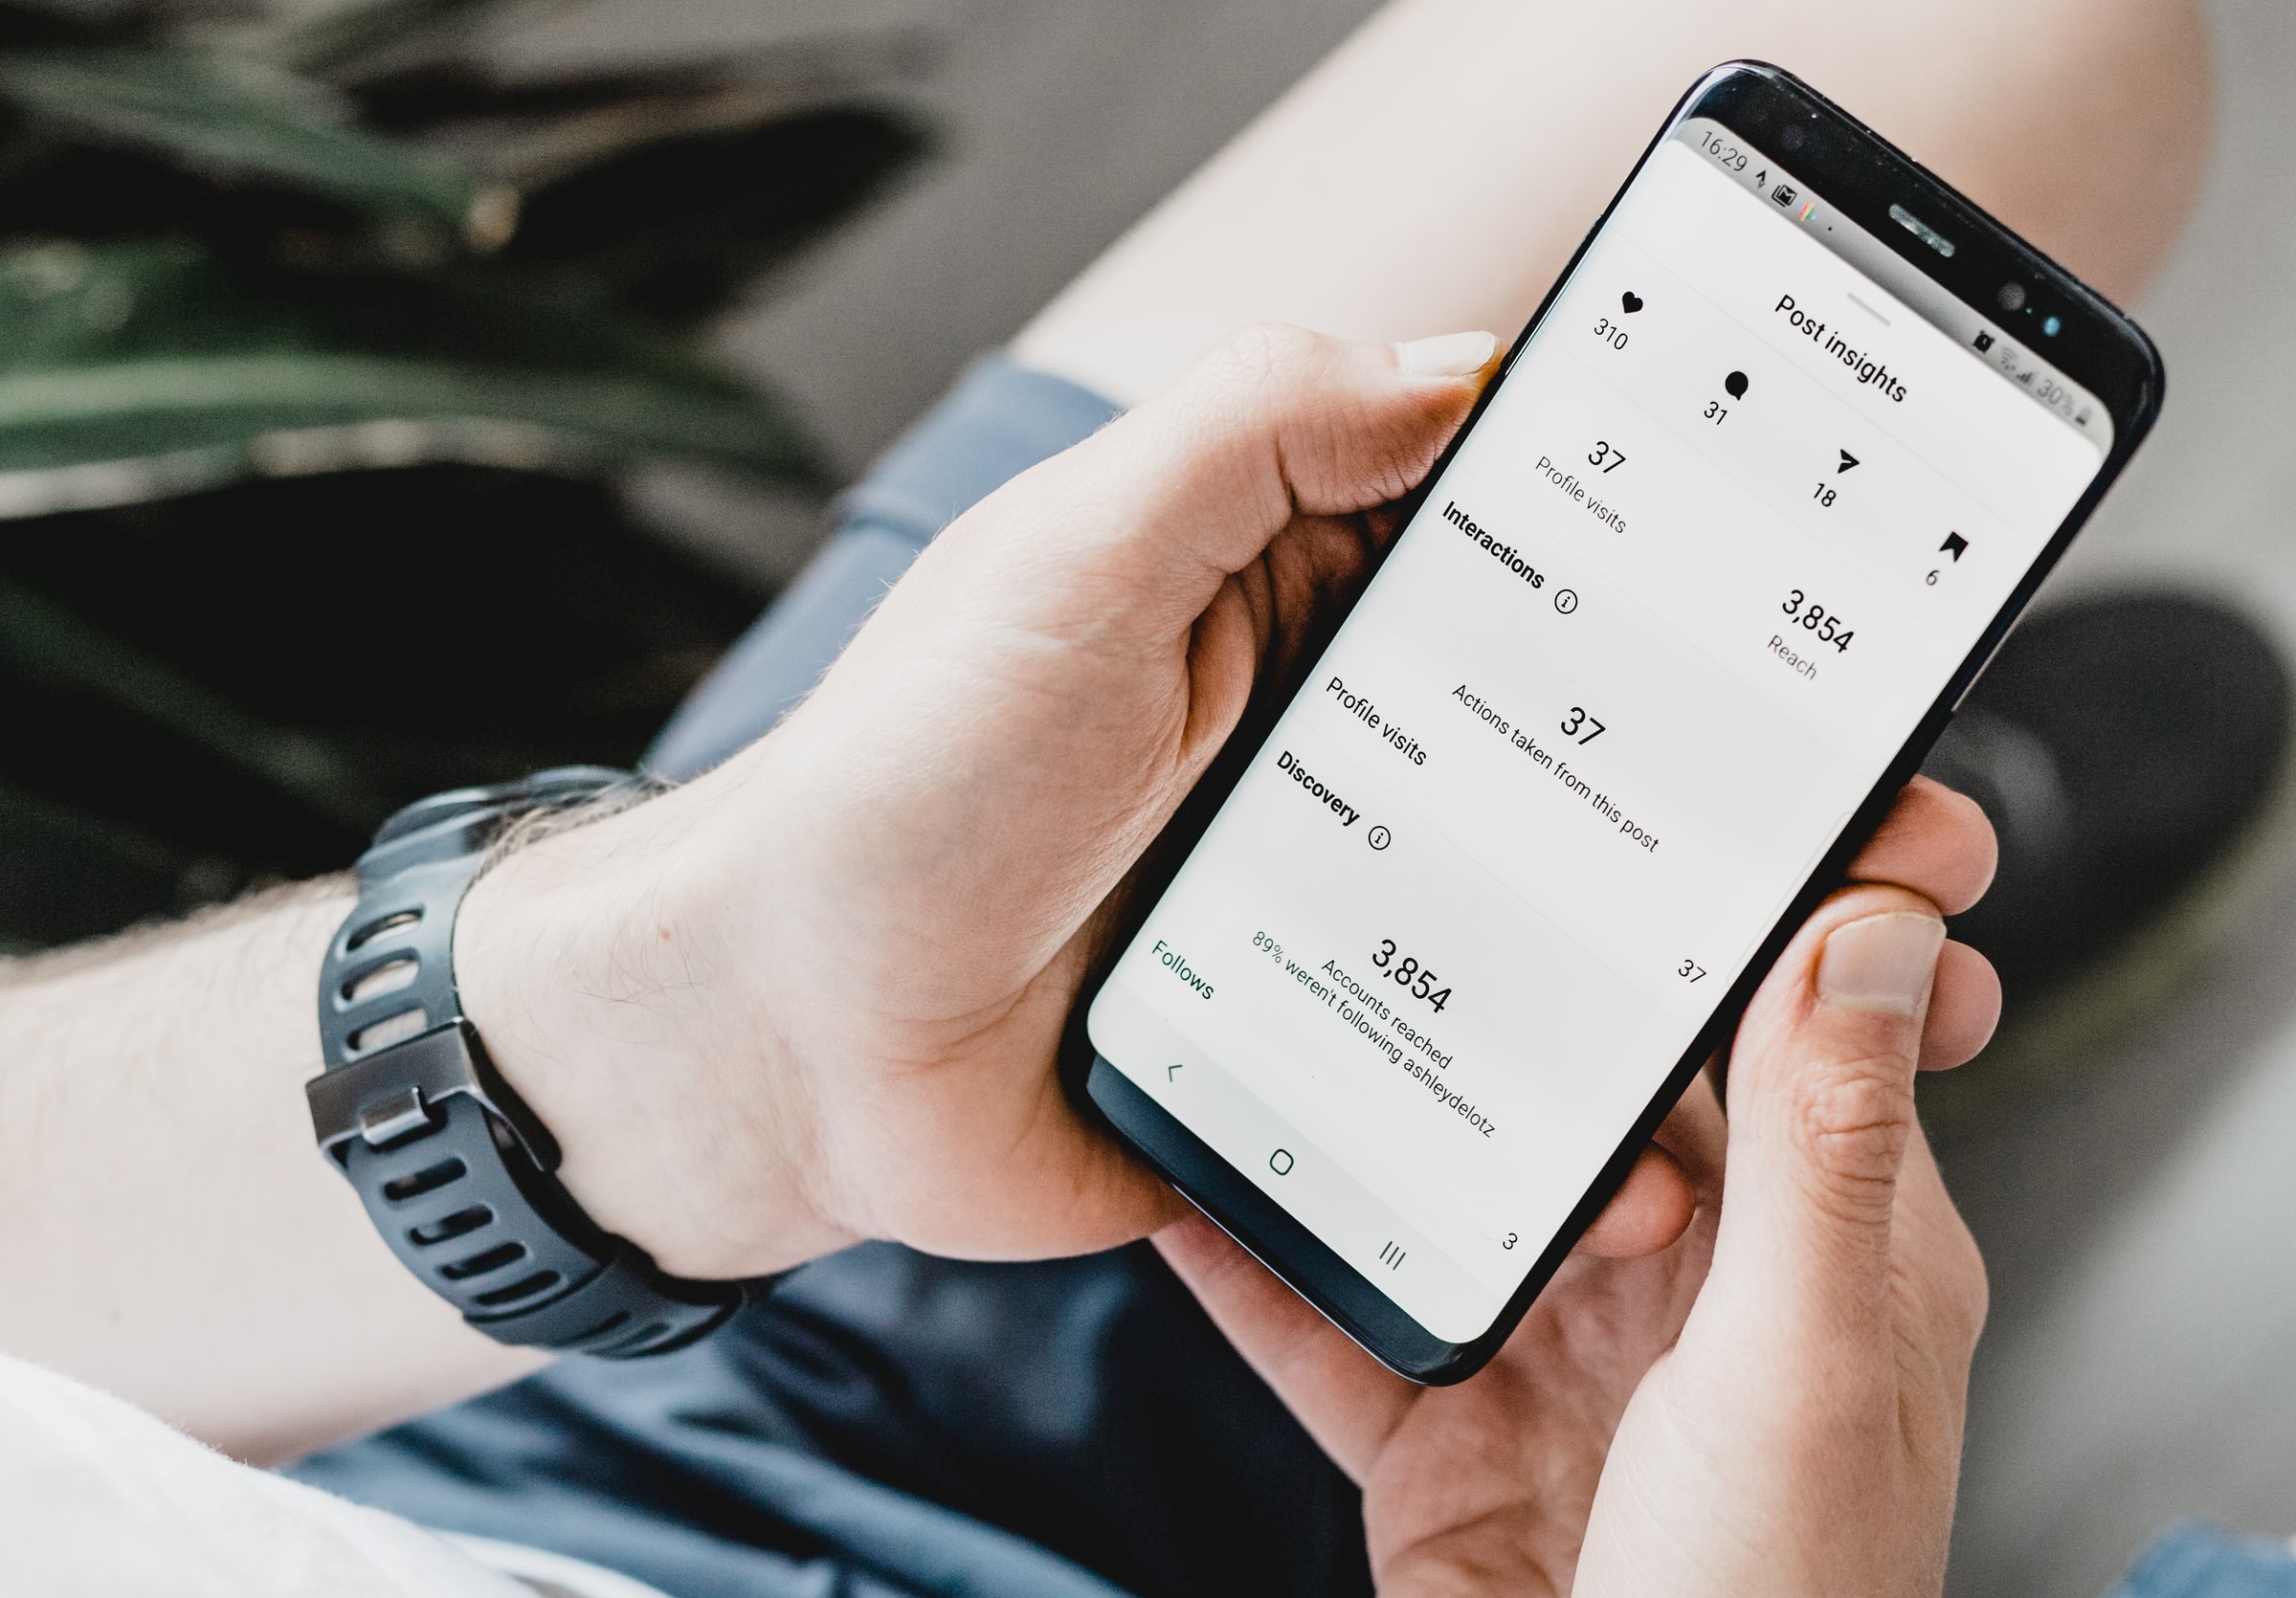
Can you imagine being able to check whether or not your friends liked what you talked about in a graphic? Well, this seems like an episode of Black Mirror rather than real life, but on social media this is possible. Thanks to Instagram Insights, we can know what works best among our audience and use it as a guide to create successful content.
When we talk about a brand, measuring results is essential to knowing how to guide campaigns. If you are an advertiser or a company and you work with influencer marketing, you already know that measuring the results of your actions is essential to understanding whether you are targeting the right audience. So whether you are an influencer, an advertiser, or simply interested in knowing the impact of your Instagram posts, keep reading this post.
What is Instagram Insights and how do I activate it?
Instagram Insights is a native analytics tool which provides data on follower demographics and actions, as well as content. Insights is only available on the Instagram mobile app.
You can use Instagram stats to understand who is interacting with your business and how. You can also view individual statistics of your audience’s interaction with your IGTV posts, stories and videos. In addition, you will also have access to paid activity in this section.
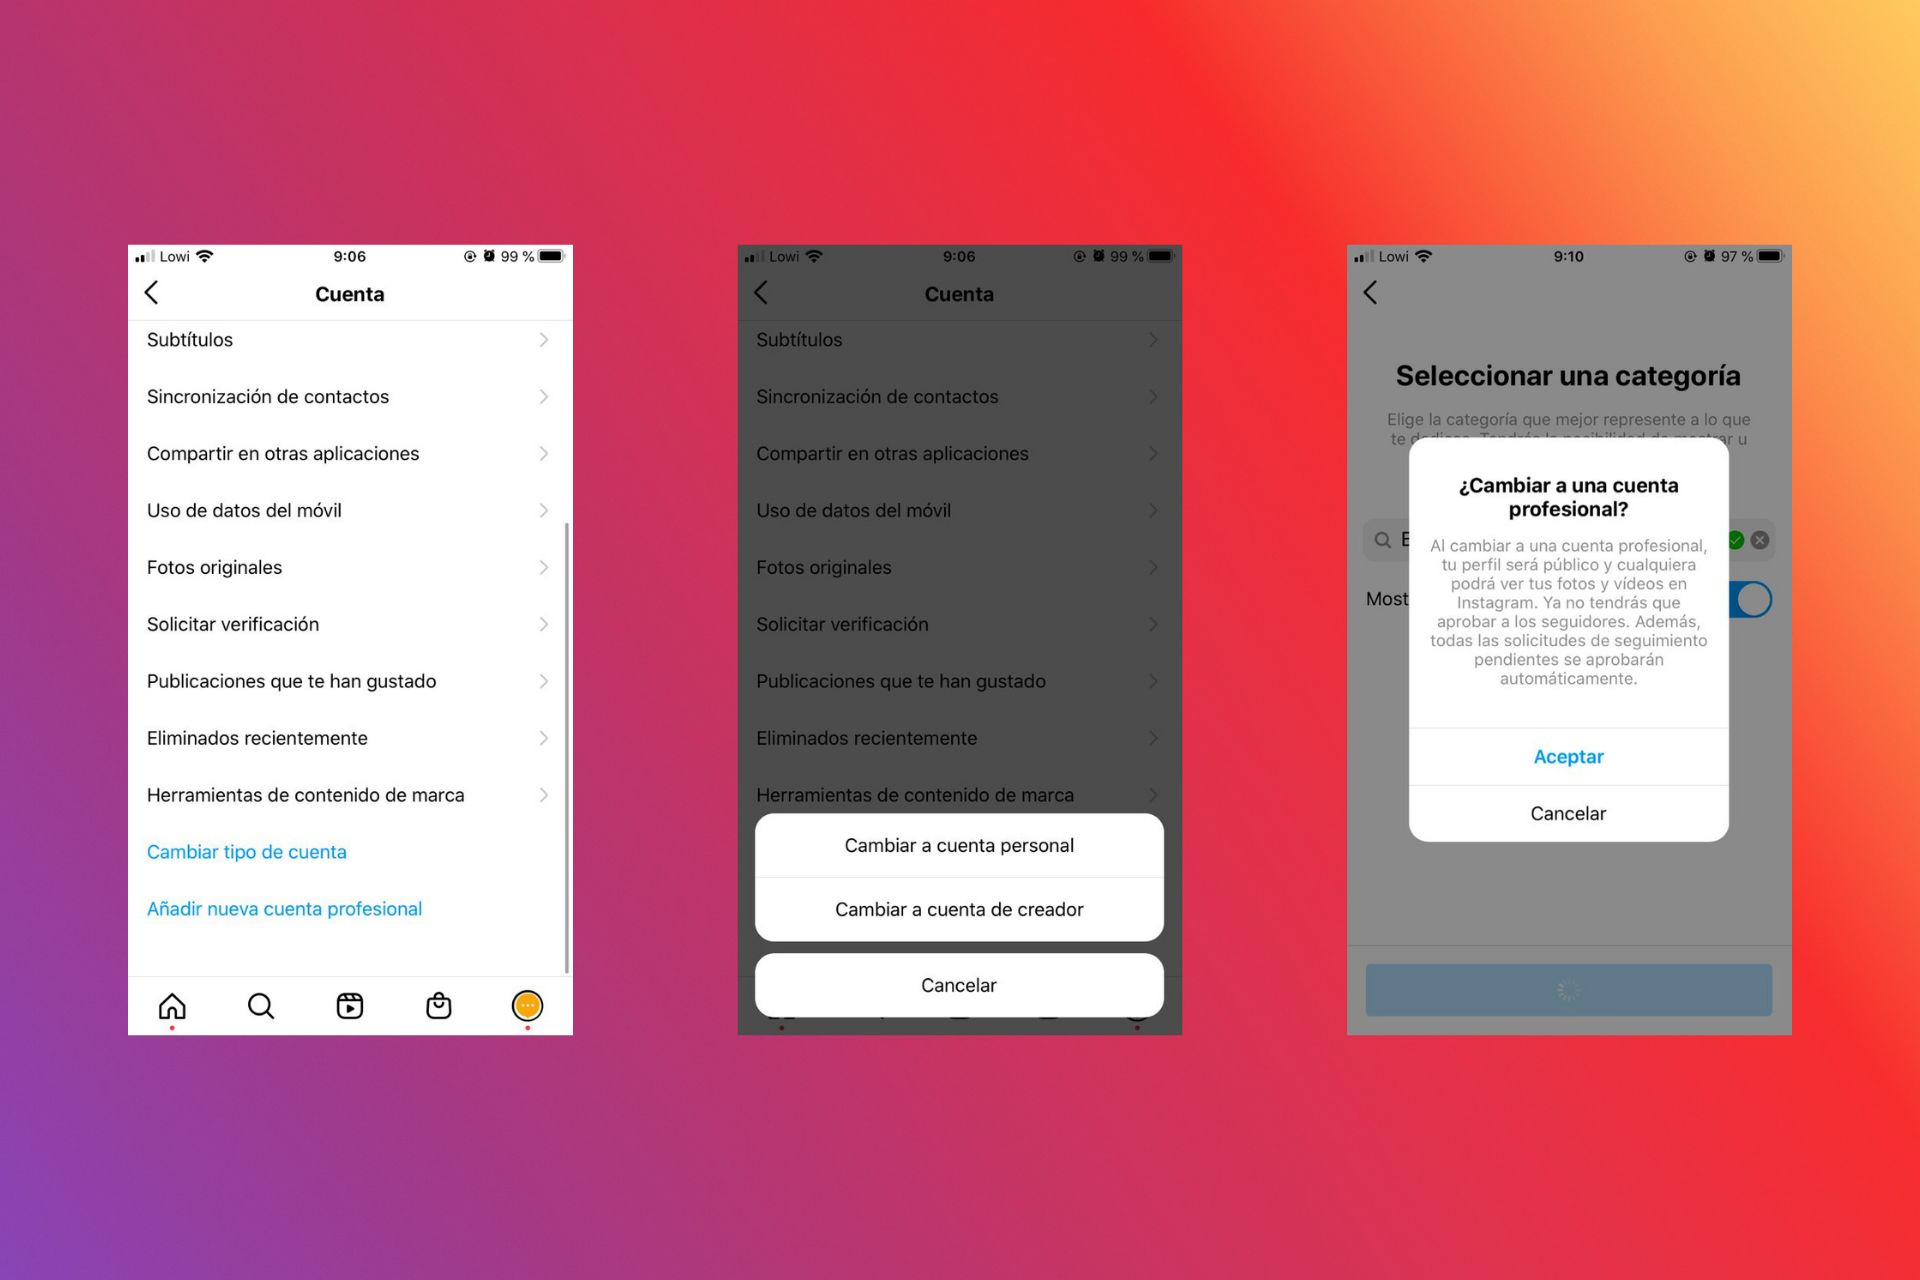
In order to include Instagram analytics in your profile, you need to have your business or content creator account activated. Therefore, the first step is to convert your personal account to a business account. It’s very simple, we are going to explain it step by step:
- Go to your profile and tap on the hamburger menu in the top right corner and tap on settings.
- Within settings, go to account and at the bottom tap on “switch to professional account”.
- Here you have to choose the “business” option. You will be able to link your business account with a Facebook page associated with your business, but this step is optional.
- Add your business and contact information and you’re done!
 How to view your Instagram Stats
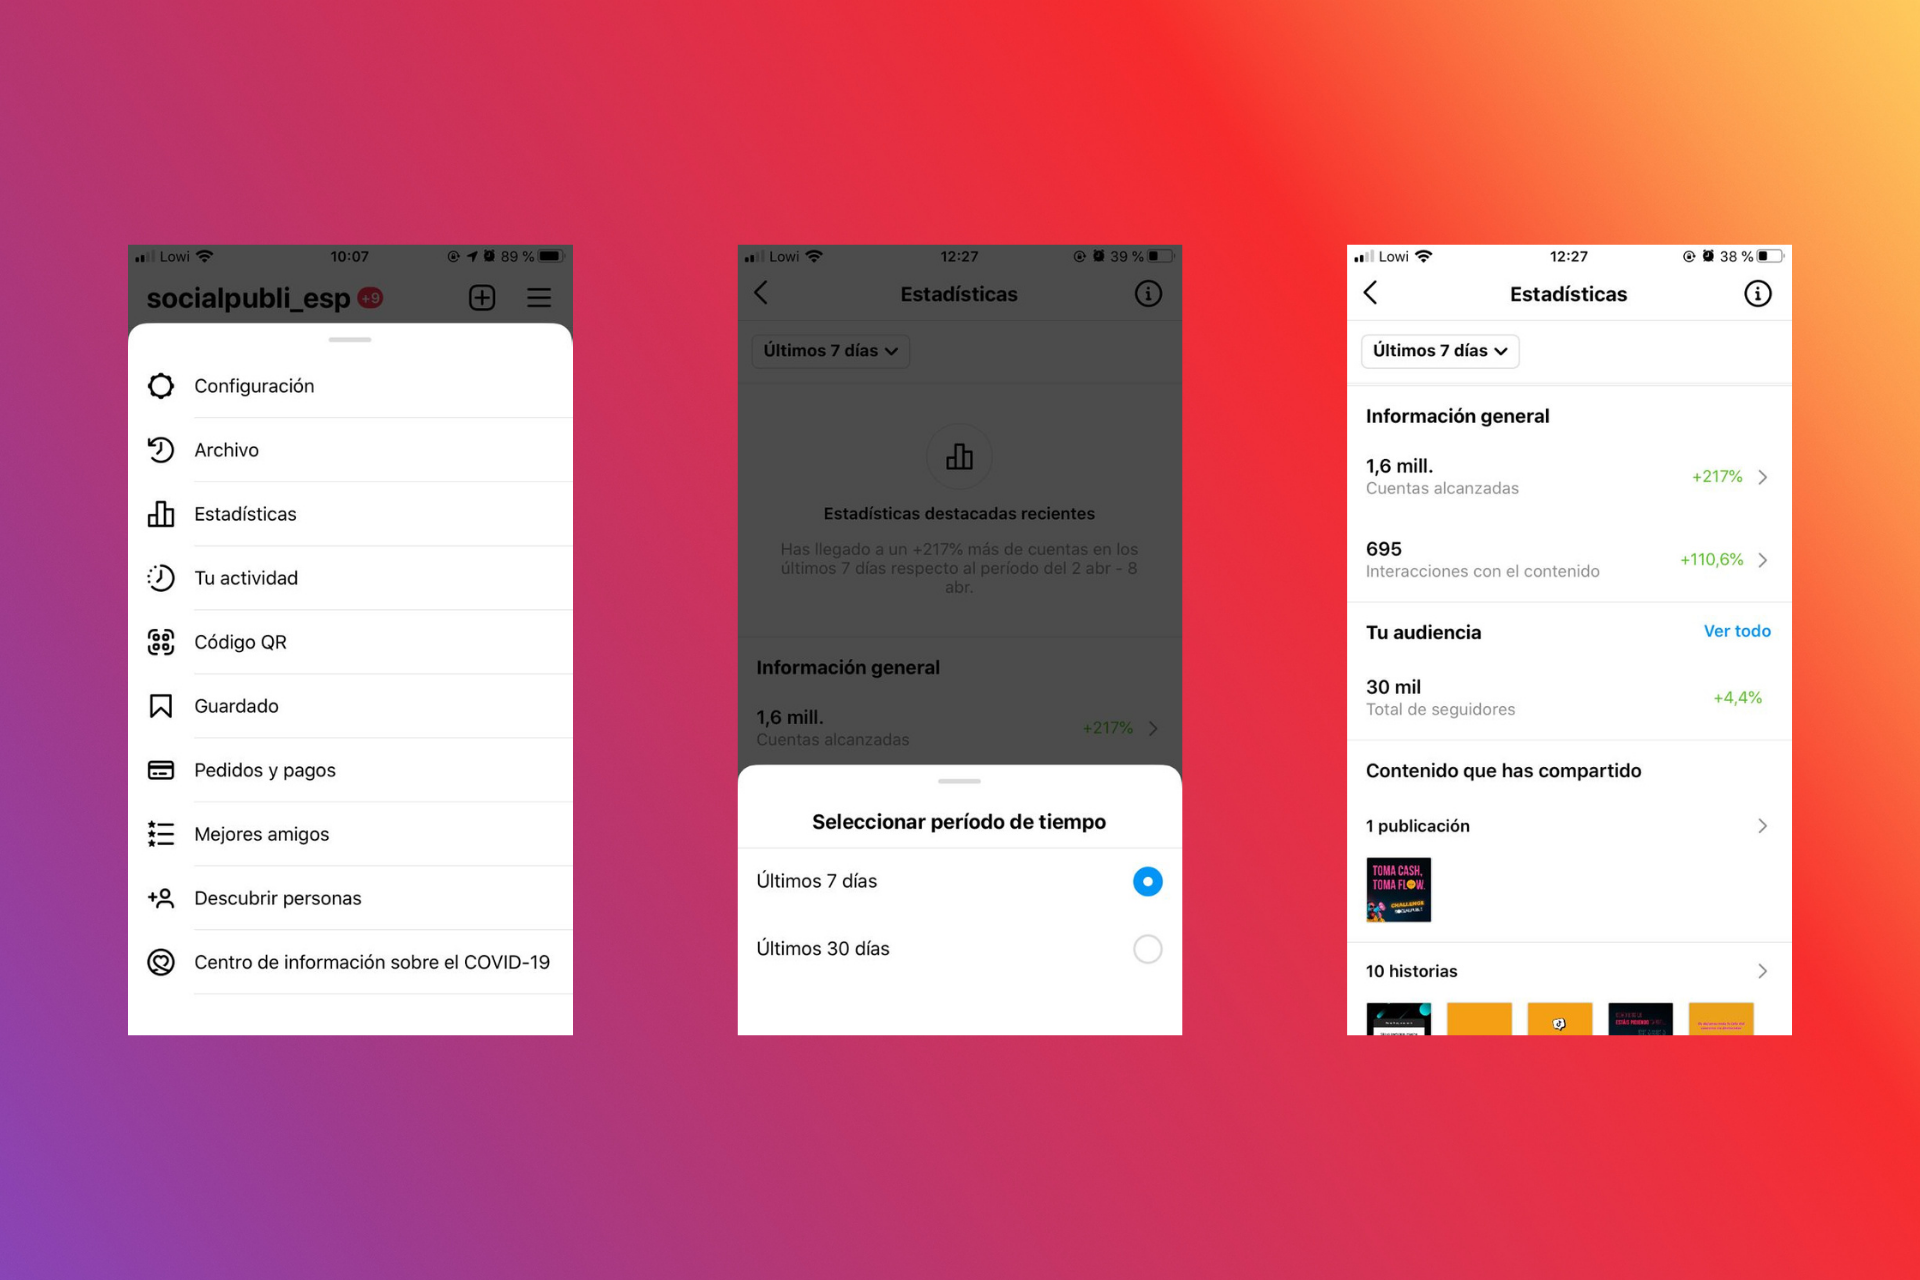
You can now view your Instagram stats from several places within your profile.
- In the stats section within the menu. Here you can select the period over which you want the stats report to be generated. You can choose between the last 7 or 30 days. In this section, you will find the general metrics of your account regarding interaction, your audience and content.
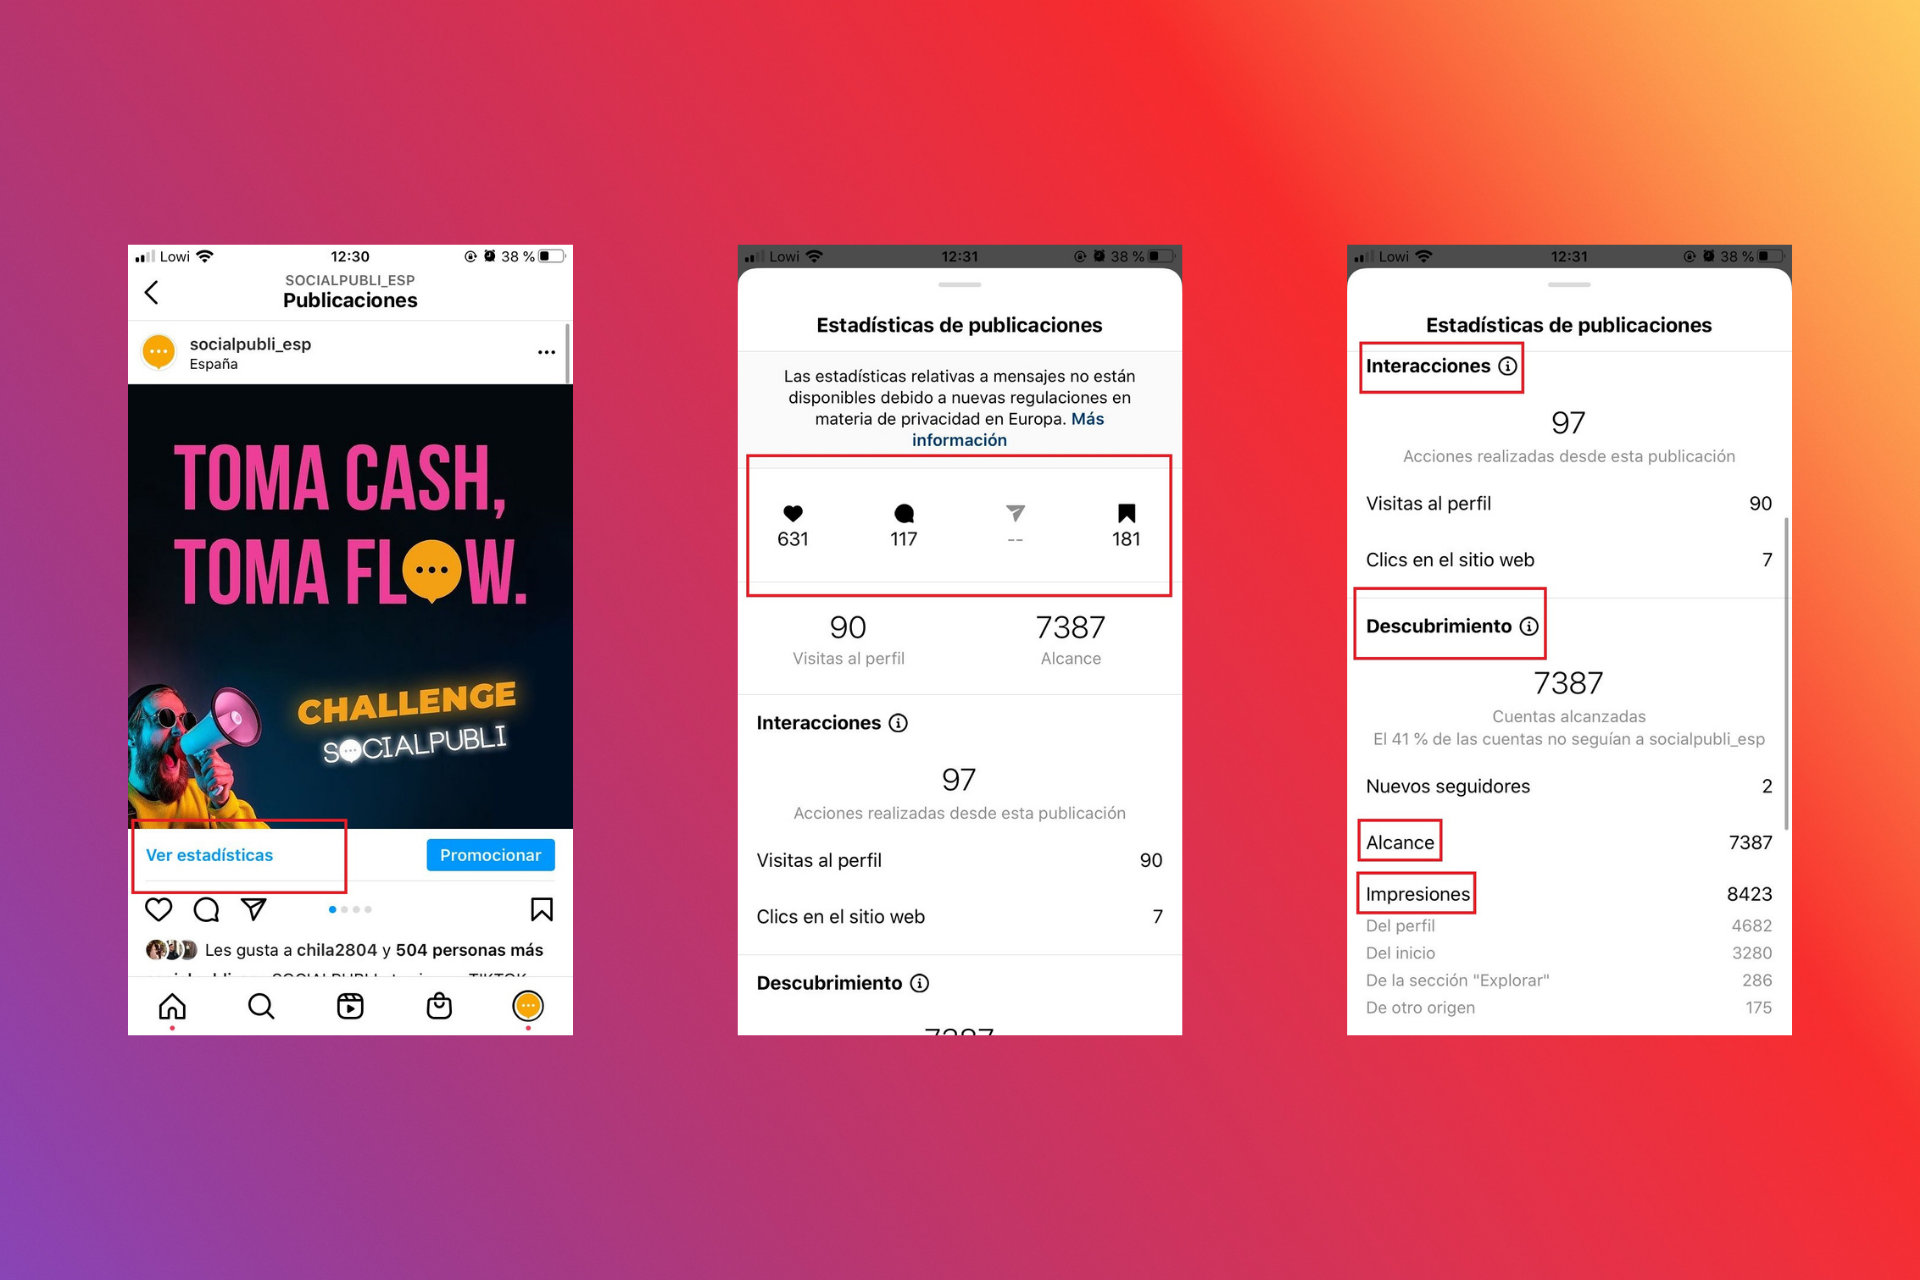
- On each individual post in the feed. In your profile, select a post you want to know the data on by tapping on “view stats” located just below the post. Here you can see the individual performance of that post, whether it is a photo or a video.
- On Stories. You can check both active stories, as well as those that are already archived. Enter a Story and scroll up, you will see the number of viewers and right next to it the stats.
 Metrics on Instagram
Now that you know how to access your Instagram account statistics, it’s time to know what each one of them means. We are all clear on how to measure likes and comments, but analytics can take you a step further. This tool provides a lot of useful data to get to know your audience better. But if you don’t know how to interpret them, they won’t be of any use. To make it easy for you, here is a dictionary with instagrammer terminology:
Posts in the feed
- Saved: as the name suggests, this is the number of times a post has been saved in the saved section by a user. This metric is very important because saved content may be viewed again some time after the original post, extending the life of your posts. It appears next to likes and comments.
- Reach: refers to the number of unique people who have seen your post. If the same person sees the post twice, it counts as one. This is one of the data that we must take into account the most, since it tells us how many of our followers see our content. Usually, it is impossible for Instagram to show all your followers what you post, but the more accounts you reach, the greater your brand awareness will be. Try to increase this metric by analyzing what works best on your profile.
- Impressions: this is the number of times your post has been seen. We must not confuse the term reach with impressions; the same user can give you more than one impression. Within impressions, the tool breaks down where these views come from: from the home page, from the profile, from the “Explore” section or from another source. For example, if you see the last SocialPubli post 5 times, it will have 1 reach, but 5 impressions. Easy, isn’t it?
- Interactions: refers to the total number of actions people take when interacting with your account through that post and includes profile views and clicks on your profile website.
- New followers: this is the number of people who have started following your account through that post.
Stories
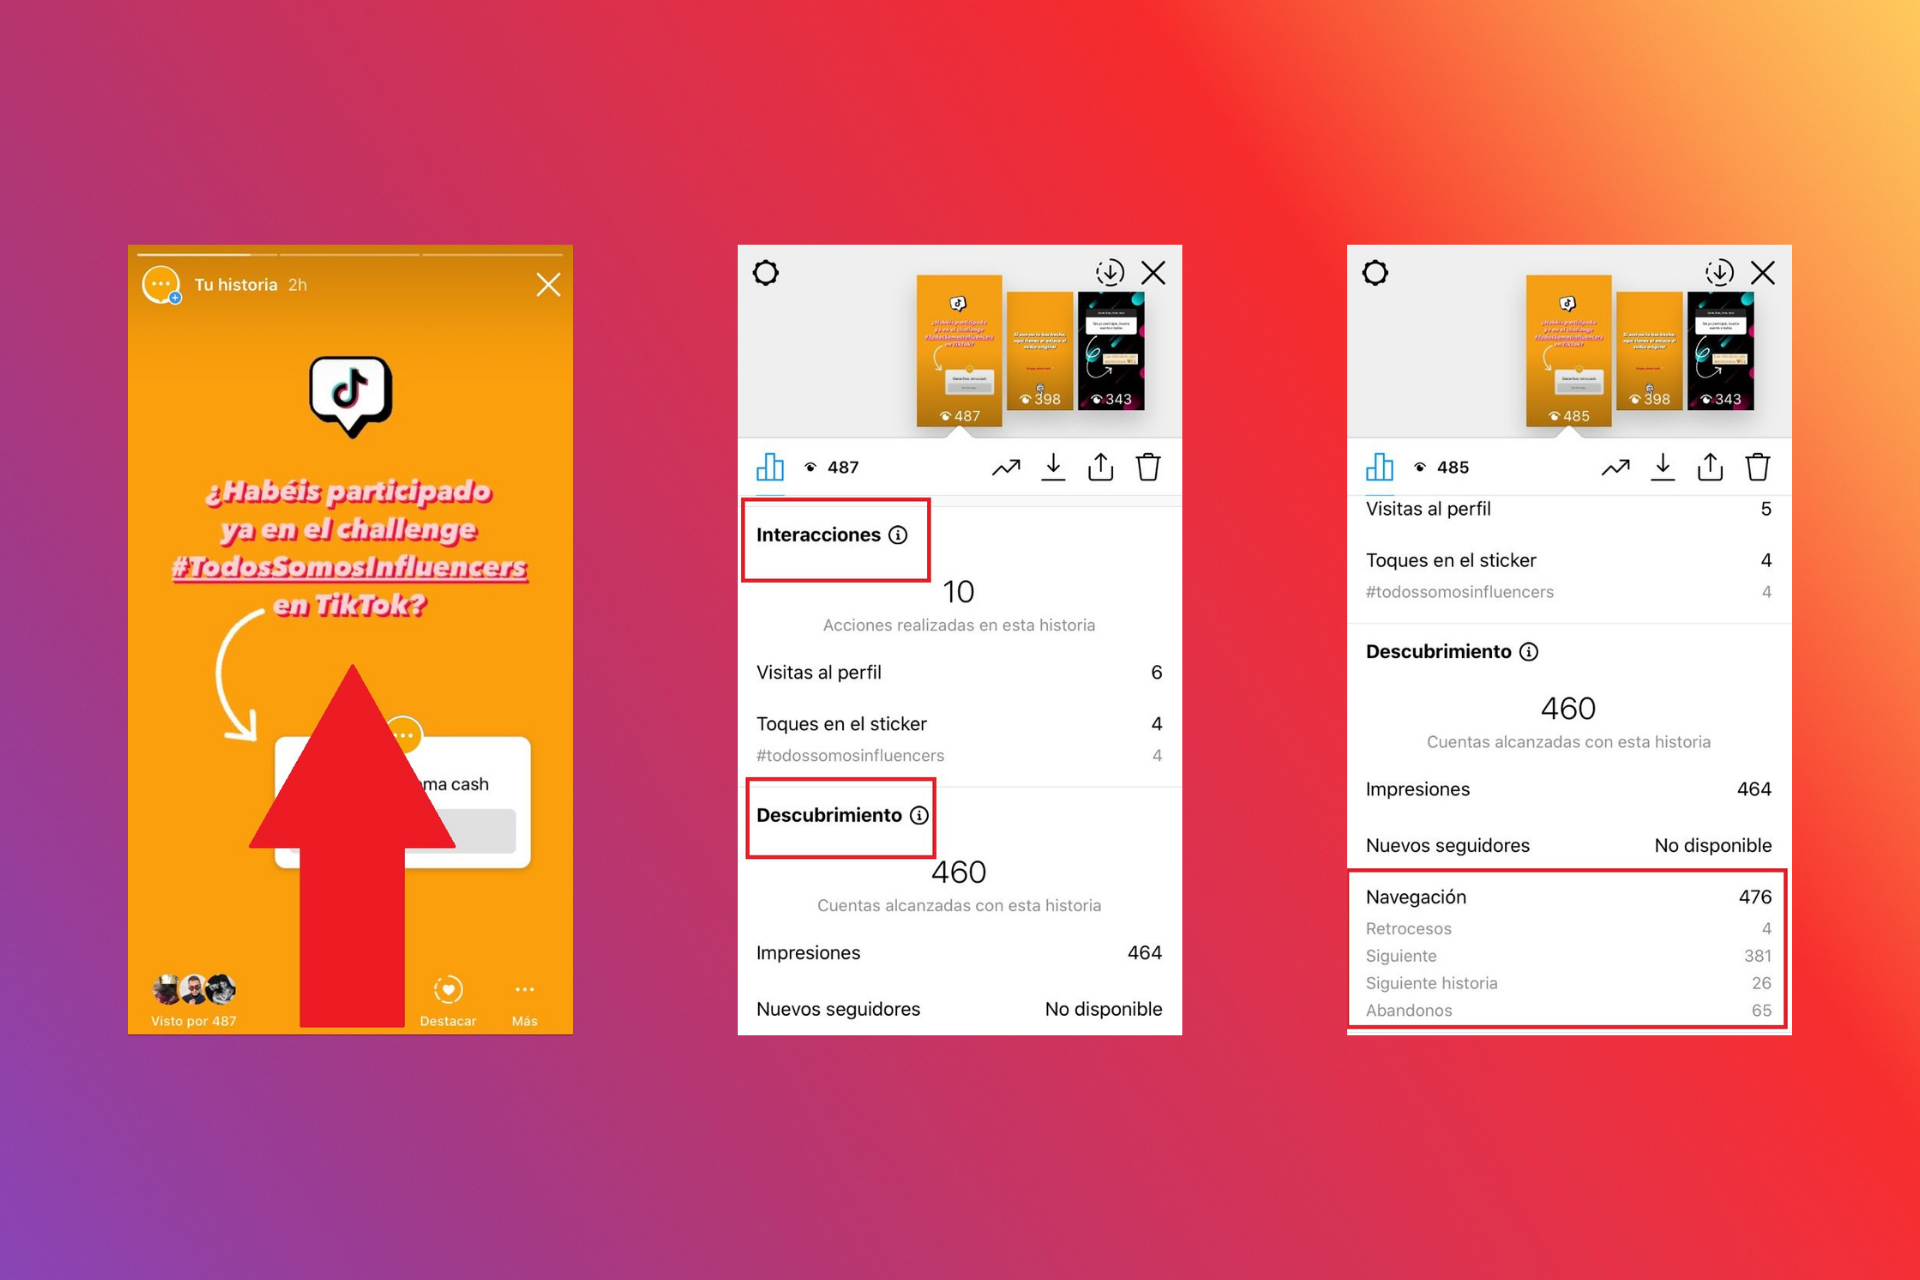
On Stories, apart from the metrics of reach, impressions, interactions and new followers, which work in the same way as with fixed posts, we can check the navigation metrics, which are divided into:
- Back
- Forward
- Next story
- Exited
Statistics section
In addition to the data we have seen so far, in the statistics section within the menu, we can access general statistics of the account, your audience and your content:
- Overview: on the one hand, we can see the number of accounts reached and interactions with the content. If we access the reach, it gives us more specific profile data, such as clicks on the website and on the “email” button. As mentioned above, we can select the 7-day period or the 30-day period.
- Your Audience: here we find demographic data of the followers (place of origin, gender and age), as well as followers gained and lost, and the moments of greatest activity of your audience. This section is an important tool for discovering your buyer persona and targeting your branded content correctly. You can also base your publishing hours on the most active times.
- Content you shared: this is another very useful section when it comes to knowing how your publications are working. On one hand, we find the publications in the feed where we can see the statistics for up to a full year. On the other hand, we have Stories, with a maximum period of 30 days of analysis. In both cases, we have the option to sort the publications in order of success according to reach, impressions, comments, etc.
Instagram today exceeds 1 billion users. With so much competition, you should analyze your content, know what works best and what your audience likes the most. Linking with the example we gave at the beginning, if you talk to your friends all day about things that do not interest them, you will end up boring them. So it is important to know how to share things. In the end, it’s all about communicating what you are passionate about and putting a pinch of empathy on it.
We hope this post has helped you better understand Instagram metrics, and your followers. Do you already have a business account? Tell us if you use Instagram Insights and which one is your favorite.